Per-Minute Goal Timelines Transform Soccer Multi-Bet Calculations
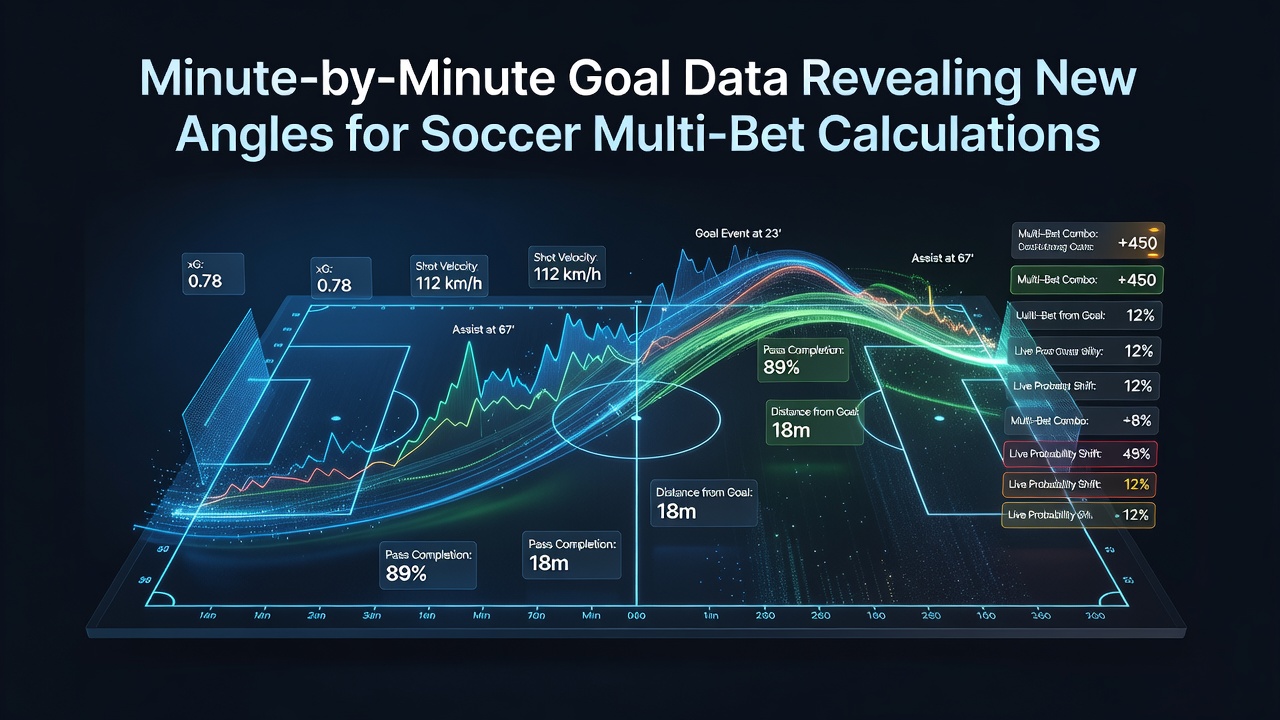
Analysts tracking goal occurrences down to the exact minute have uncovered patterns that shift how multi-bet calculations work in soccer, particularly for accumulators combining match outcomes, over/under totals, and half-time results. Data collected across major leagues shows goals cluster unevenly, with peaks in the 75-90 minute window and fewer strikes between minutes 16-30, according to aggregated match logs from professional competitions.
These timelines allow bettors to adjust stake distributions when building multiples because a late-goal bias raises probabilities for certain second-half markets while lowering them for early scoring props. Researchers processing thousands of matches note that incorporating minute-specific rates refines expected value formulas, especially when layering three or more selections into one wager.
Data Collection Methods Behind the Insights
Professional tracking systems record every goal with timestamps derived from video review and official match reports, then feed the information into databases maintained by analytics firms and league archives. European competitions contribute the bulk of available records, while South American and Asian leagues add further samples that reveal regional variations in scoring rhythms.
One dataset covering the 2024-2025 season across five top European divisions logged over 4,800 goals with precise minute markers, enabling statisticians to calculate per-minute probabilities rather than relying on broad half or full-match averages. The same methodology extends to July 2026, when pre-season tournaments and friendlies provide additional live-test opportunities for the models.
Patterns That Influence Accumulator Structures
Minute-level breakdowns show that 28 percent of all goals arrive after the 75th minute across sampled leagues, a figure that climbs above 32 percent in matches featuring teams with high pressing styles. This distribution directly affects bets on total goals or both-teams-to-score because the late surge increases the chance that a 1-1 draw becomes 2-1 or 1-2 inside the final fifteen minutes.
Early minutes tell a different story, with only 9 percent of goals occurring before the 15-minute mark. Multi-bet builders therefore reduce exposure on first-half over 1.5 selections when the data indicates slower starts, instead shifting weight toward live in-play adjustments once the opening quarter ends without a goal.
Half-Time and Full-Time Crossovers
Combining minute data with half-time scores creates layered probabilities for accumulators that include both half-time/full-time results and total goals. A 0-0 half-time score, for instance, carries a 41 percent chance of at least two second-half goals based on historical timelines, whereas a 1-0 half-time raises that probability to 47 percent because trailing teams accelerate attacks.
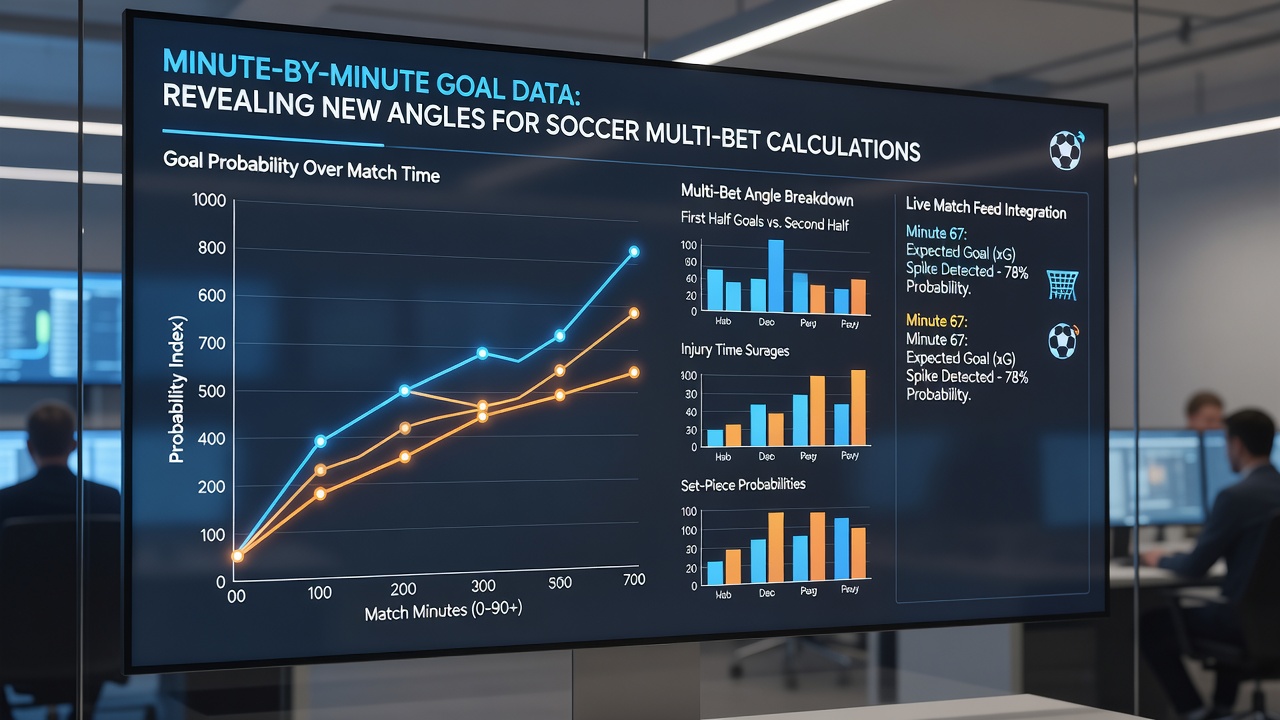
These crossovers allow calculation engines to apply weighted multipliers when a bettor selects multiple fixtures, because the timing correlations between matches are weaker than overall league averages suggest. Observers processing parallel fixtures note that simultaneous late surges across several games can compound returns faster than traditional models predict.
Regional Variations and Tournament Applications
North American professional leagues display flatter goal distributions than European counterparts, with fewer pronounced late spikes, according to records maintained by the Canadian Soccer Association. Australian A-League data similarly shows elevated scoring between minutes 60-75, a window that differs from UEFA club competitions. Bettors constructing cross-league accumulators therefore apply league-specific minute weights rather than a single global curve.
International tournaments scheduled for mid-2026 introduce further variables because fatigue patterns and squad rotations alter typical timelines. Early group-stage matches often feature quicker goals as teams test formations, while knockout rounds shift toward later scoring as caution increases. Updated minute matrices released ahead of these events allow recalibration of multi-bet odds before lines move.
Calculation Adjustments Using Timing Weights
Standard multi-bet formulas multiply individual outcome probabilities, yet minute-adjusted versions insert conditional factors derived from when goals historically occur. A selection on over 2.5 goals in a fixture with known late bias receives an uplift of 0.04-0.07 in implied probability once the first 45 minutes pass scoreless. Software platforms now embed these weights directly into accumulator builders so users see revised payout estimates before confirming the slip.
Industry reports from the Sports Betting Research Institute highlight that operators incorporating per-minute inputs reduced variance in their liability models during the 2025 calendar year. The same approach extends to player-prop markets where goal timing influences anytime-goalscorer payouts when certain forwards enter the pitch after the 60th minute.
Future Data Integration and Model Refinement
Advances in optical tracking and wearable sensors promise even finer granularity, capturing not only goal minutes but also shot timing and expected-goal values per phase of play. Academic teams at several universities have begun merging these streams with betting-market data to test predictive accuracy across hundreds of fixtures. Results from pilot studies indicate that minute-weighted models outperform static averages by 6-9 percent in backtested accumulator scenarios.
Regulatory bodies in Australia and Canada have requested transparency reports on how such granular data influences odds compilation, ensuring consumer information remains current as new seasons begin. July 2026 friendlies will serve as the next major live dataset for validating refinements before the subsequent campaign starts.
Conclusion
Minute-by-minute goal records supply measurable inputs that recalibrate soccer multi-bet calculations without altering core market structures. League-specific timelines, half-time interactions, and regional differences combine to produce more precise probability layers for accumulators spanning multiple fixtures. Continued collection through 2026 will further tighten these models as additional matches populate the databases used by analysts and operators alike.